Top 3 Free TradingView Indicators
Tradingview is a well-known financial analysis platform. It is used by investors to study the movements of bitcoin (BTC), cryptocurrencies and other financial assets. Among its essential features are the numerous chart and indicator options present in its free version.
TradingView define to indicators such as “a function based on trading statistics which allows us to predict the future movement of the market.” In other words, they process mathematical and algorithmic calculations using elements such as maximum and minimum prices, trading volume, market volatility, etc., to obtain information about a financial asset.
TradingView’s free plan, for example, allows you to choose from 100,000 indicators provided by the platform. Many more of these 100,000+ are accessible through premium packages. It is worth noting that the platform only allows the use of two indicators simultaneously in its free version, which represents a limitation. However, as the TradingView subscription increases, more indicators can be added together.
Some indicators are provided by the platform itself. Others are created and shared by TradingView users in the Public Library on the site, who may require payment to use them.
In this review, only the indicators will be considered that belong to the orbit of the free plan and those created by other users that do not require payment or authorization.
1. Moving Averages
Moving averages are the first of the best and most widely used indicators by investors.
These represent the price action of an asset over a given period of time. from the past to the present and create an average using these two edges. TradingView allows you to customize time periods.
As the price moves, the averages create a continuous line that reports how the asset performed within the chosen period. The most commonly selected time frames include 200, 150, 100, 55, 30 or 10 periods, among others. The expression “200 periods” is understood here as referring to the last 200 candles of the selected chart that represents the price action.
Moving averages are very simple and pragmatic in understanding the trend of an asset and measuring market momentum.
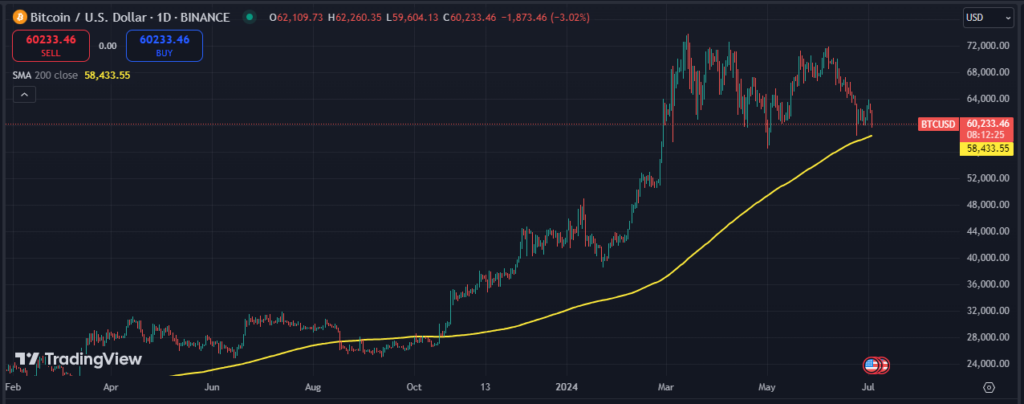
For example, the following chart from TradingView contains the price of bitcoin (BTC) and a 200-period moving average in yellow.
As you can see, the yellow line is below the current price of BTC. This is telling us that the price of bitcoin is averaging at high levels over the last 200 periods. As of July 4, 2024, bitcoin is more expensive than the average price over the last 200 candles.
Many traders They also use several moving averages simultaneously. There are some moving average indicators that allow a little “cheating” within TradingView by enabling more than two moving averages together. This allows moving averages to be used as potential support and resistance zones.
This can be seen more clearly in the following TradingView chart. It shows four moving averages, in addition to the yellow 200-period one above: the 100-period one in blue, the 55-period one in red, and the 30-period one in green.
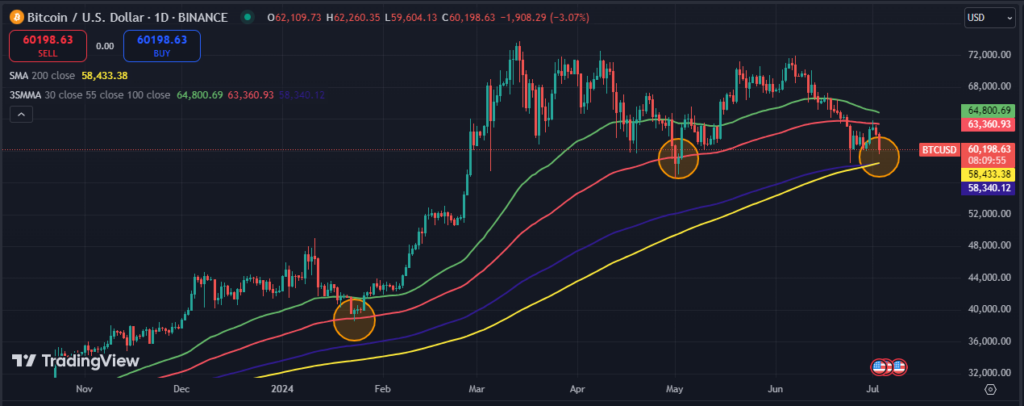
In turn, two rebounds (orange circles) are detected that the price of bitcoin made when it came into contact with the 55-period moving average determined by the red line.
Thus, if this process were repeated over time, investors would use the 55-period moving average as a support zone where there was greater confluence between supply and demand. These reference points found through moving averages usually provide entry or exit signals for traders. traders.
Finally, the price shown in the chart above was rejected by the red 55-period line. In this case, the 55-period moving average, which was previously a support zone, now turned into resistance, bouncing lower as BTC attempted to break above it.
2. Relative Strength Index (RSI)
Secondly, the Relative Strength Index (RSI) is a momentum oscillator indicator used to assess the speed and magnitude of price changes. It shows the strength and weakness of a market based on closing prices over a specific period.
This indicator, shown below the BTC price action in the TradingView chart below, is expressed by a violet line oscillating within a horizontal zone, violet in this case as well, delimited by two white dashed horizontal lines.
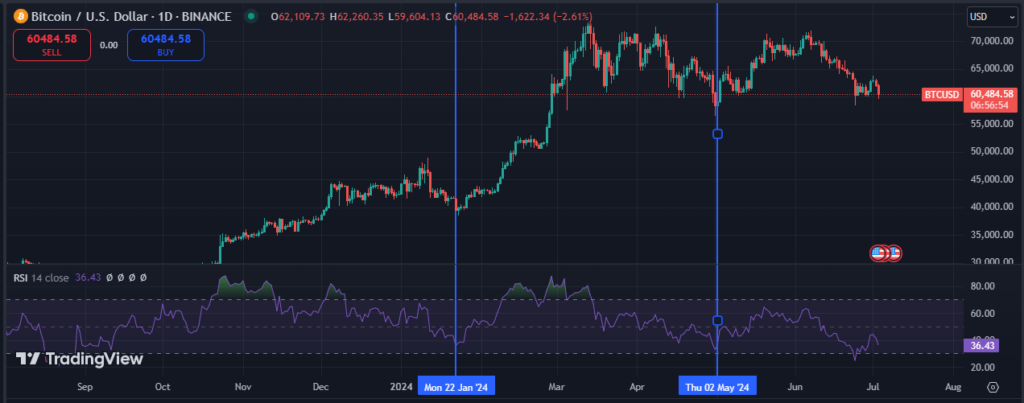
Thus, the purple line that travels within the horizontal zone to the dashed white linesindicates when an asset is “oversold” or “overbought.”
Upon touching the white dashed line below, the RSI indicates that BTC is in an oversold zone, which could be interpreted as an attractive buy point.
It can also be seen how after the RSI marked that oversold parameter, the price of BTC rose many times.
This is shown by the vertical blue lines: RSI close to the lower zone, the BTC price rose as the RSI approached the upper zone.
3. Fibonacci Retracements
Fibonacci retracements is an indicator used to identify how far a market has moved. may move against its current trend. Shows areas where investors can open or close trades.
Based on the famous Fibonacci sequence, where each zone represents a number that is the sum of the two previous ones, this tool allows you to draw key levels in the market.
Once the indicator is selected, the cursor must be dragged from the last highest price to the lowest price within the selected downtrend. This is how it is expressed in the TradingView chart.
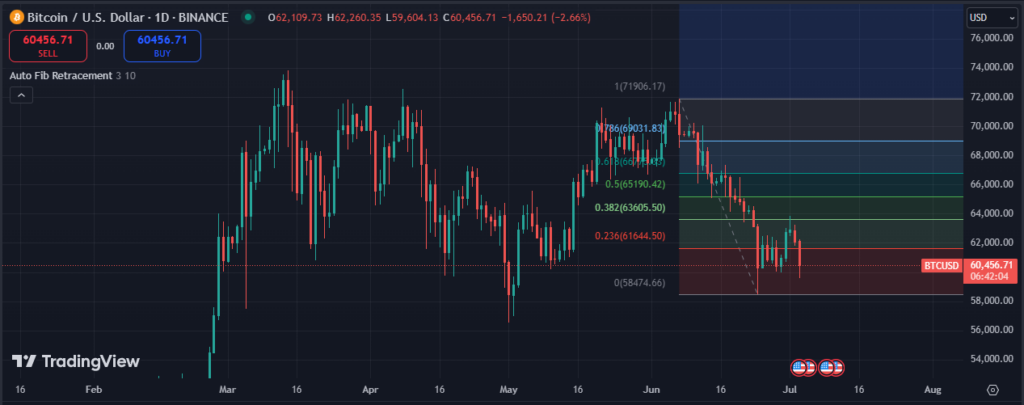
During market downturns, the traders They use Fibonacci retracements to identify support and resistance zones or levels. Thus, they can detect possible bullish or bearish rebounds, at each of those points automatically established by the Fibonacci indicator.
These levels indicate potential points where the market could reverse its current trend, reverse or stabilize.
In addition, there is the Fibonacci Extension tool, which works in the same way, but to detect movements during an uptrend.
And what are paid indicators on TradingView?
Among the paid plans that the platform offers, there are those indicators related to the volume profile and the buying and selling opportunities (TPO).
The first mentioned are advanced indicators that express trading activity on a chart, based on the trading volume at different price levels during a specific period, making this information visible to the trader.
As CriptoNoticias reported, the buying and selling opportunity indicators analyze market activity by price levels over time.
On the other hand, by registering on TradingView and purchasing a subscription you can get USD 15. This platform offers several paid subscriptions, both professional and non-professional, with prices ranging from USD 13 to USD 600 per month.
However, it is worth mentioning that many users have reported that paid indicators, which promise very effective results, often do not work or are downright fraudulent. Be careful, then, when paying for indicators, especially since the best and most used ones are almost all free.