

TradingView Chart Tutorial for Beginners
TradingView is a trading platform that allows you to view, analyze and manage financial market data and charts in real time. It is used by most investors and technical analysts, both professional and novice, who are interested in the cryptocurrency market.
While it is not the only one of its kind, it is an essential tool that is worth your time and getting through the learning curve. With TradingView, we are faced with a tool that is almost mandatory if we want to raise the level of trading and financial analysis.
It is worth clarifying that TradingView is the only technical analysis platform I have used. I have not yet tried NinjaTrader or Sierra Chart, other applications that do the same. But right off the bat, and pending someone or something proving me otherwise, I do not feel that I need another one at the moment. Why? Because I perceive it as a Multi-tool adapted, fine-tuned and too complete for the job.
A seasoned and experienced camper can travel without a tent and without food to the savannah; if it doesn’t cost him more to survive, he will certainly enjoy the trip less; in my opinion, the same will happen to the trader or investor who does not use a tool of the caliber of TradingView.
This technical analysis platform has many advanced features such as the Pine Script editor for creating indicators, a strategy simulator (backtesting) to test the effectiveness of trades; also social networking functions such as chat or sharing ideas. But today we will learn, since it is not easy to find your way around its application after the first contact, the basic and usage aspects common to all TradingView subscriptions, including the free one.
We will do it in the way that I consider most intuitive: starting with supergraphics (the most important tool), its functions and from here, exploring other utilities that come our way and that we find useful.
Learning about TradingView Supercharts
TradingView’s main attraction is its supercharts. I’m referring to the characteristic graphical data terminal, with green and red candles, that we see in most technical analysis content on Youtube and that we find integrated into most exchanges.
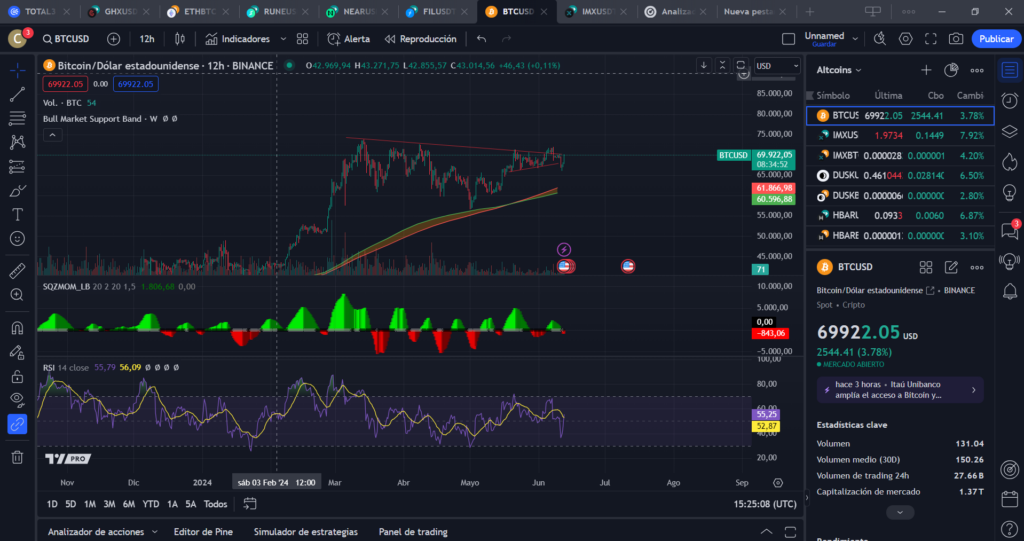
The first and most essential part of supergraphics is the symbol finder, on the left side of the top bar.

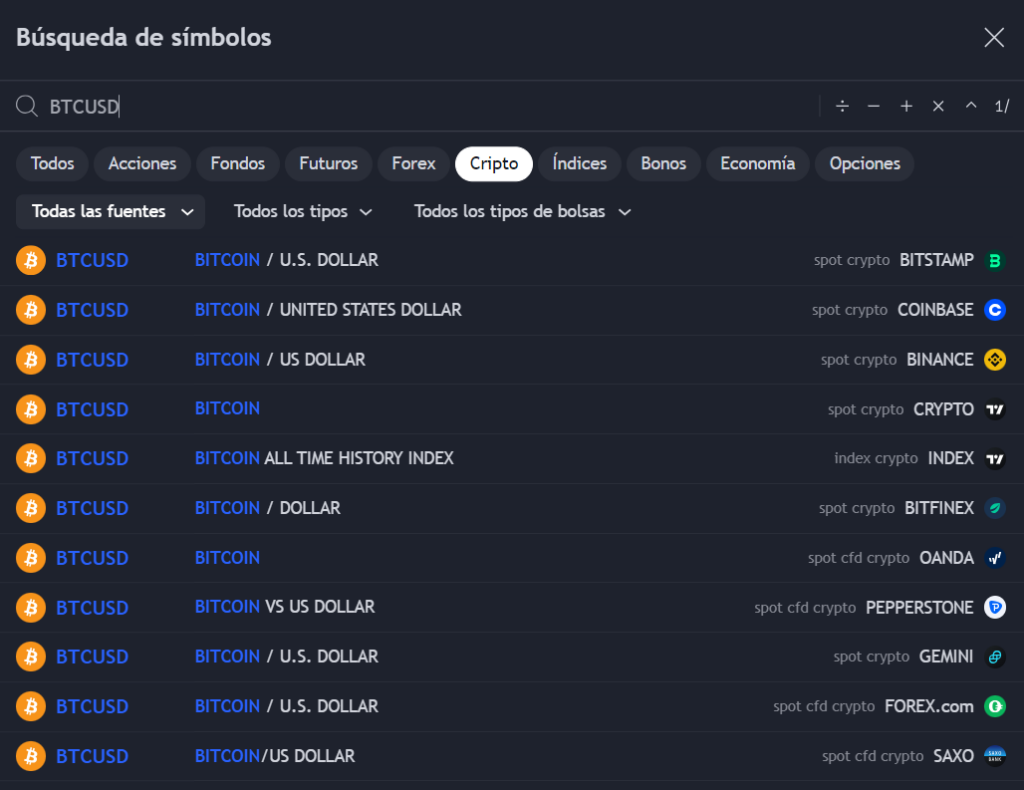
Clicking on that box will take us will allow you to filter and select the asset and its class that we are interested in analyzing. This is what gives the tool its analytical content. If we are exploring cryptocurrencies or bitcoin ETFs, it gives us access to pairs, such as
- Bitcoin vs. the Dollar (BTCUSD)
- Bitcoin vs Euro (BTCEUR)
- Bitcoin vs USD Tether (BTCUSDT)
- Ethereum vs. the Dollar (ETHUSD)
- Ethereum vs Euro (ETHEUR)
- Solana vs. the Dollar (SOLUSDT)
- Solana against the euro (SOLEUR)
- iShares Bitcoin Trust vs. the US Dollar (IBITUSD)
With it, we will also have access to data from various ETFs, currencies, indices such as the NASDAQ or SP500, futures products from around the world and more.

The technical market analysis platform
Purchasing a TradingView plan using the referral link below will earn you $15. Choose between the Professional or Regular plans. Annual subscriptions are currently 16% off.
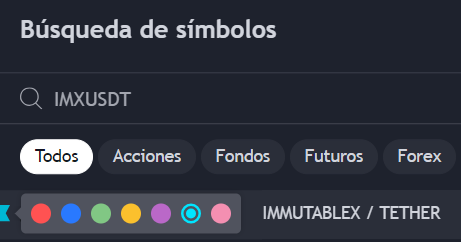
Once opened, the symbol search engine looks like the image below. Type in the search box to filter the asset of your choice and select it. If your exploration is more open, you can manually search for assets by type, country and financial sector.
It is useful to know that Historical data for each supplier varies in lengthThe provider that listed the cryptocurrency first has more data, i.e. a longer timeline, and therefore more raw material to analyze.
For now, ignore the arithmetic symbols in the top right corner of the browser. These are used to create a mathematically customized chart with multiple assets at the same time; how to use them will be covered in a future advanced TradingView tutorial.
An additional utility of the Symbol Finder is that it allows you to create a shortcut using the colored ribbon of the Symbol Finder. Use it wisely to create a custom list and Consult your favorite assets naturally and without having to find them every time.
Initial Settings for TradingView Charts
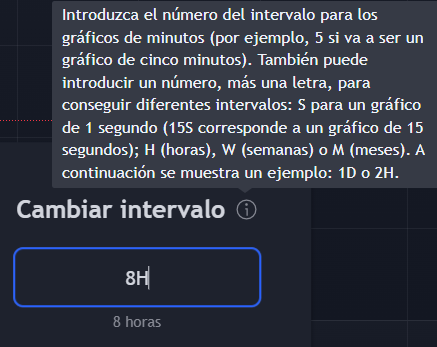
The top bar will still be useful for making some essential final adjustments before starting, such as modifying the chart according to our time preference (one hour, four hours, weekly, monthly). A shortcut that makes life easier is to customize it by tapping the numbers on the keyboard. Touching a letter will allow us to quickly access the search engine of symbols.
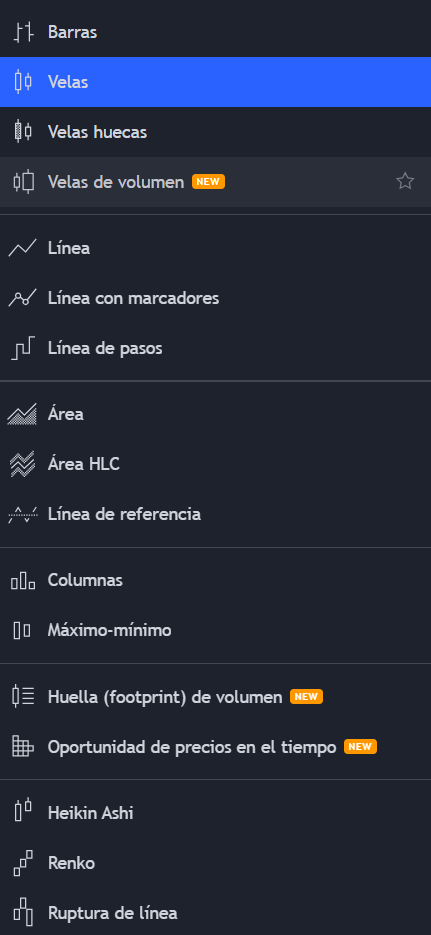
From the top bar we can also select the types of graphics we want to use: simple, such as candles, lines, areas, or complex, such as footprints of volume or time-price opportunity (TPO). You can also select, archive and activate analytical indicators such as Squeeze Momentum, Relative Strength Index (RSI), John Bollinger’s new BBTrend, moving average ribbon and much more. The ranking of the best indicators and charts will be the subject of another article.
Do you see the arrows at the end of the top bar? These:
They allow you to undo and redo actions. They are essential to using TradingView comfortably because, believe me, you will make a lot of mistakes in the process, Although it is even easier to use the commands “control + z” and “control + y”, respectively.
With that said, the basic utility of the top bar is explained. At this point, your TradingView tool will have a chart loaded with data, and you can now start editing and analyzing it with the superchart tools.
Analyzing a TradingView Chart
The tools in the left sidebar are ideal for starting to analyze a graph. Among other things, they allow you to set marks, symbols and signs. to create visual cues or plot and identify patterns on the chartwhich is a representative of the price behavior of an asset.
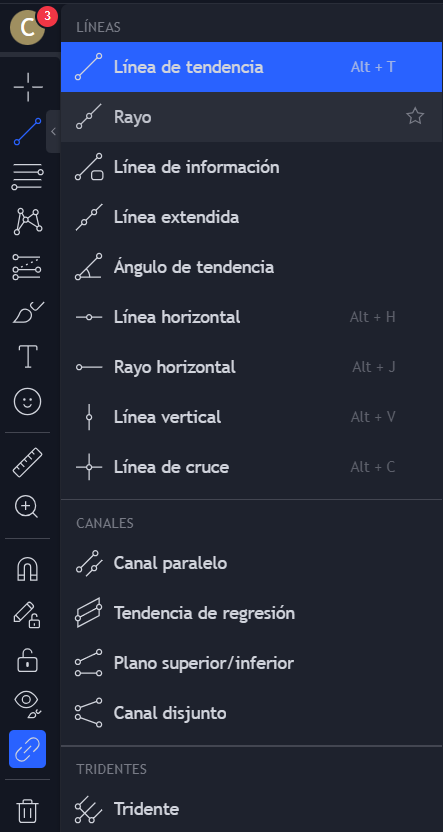
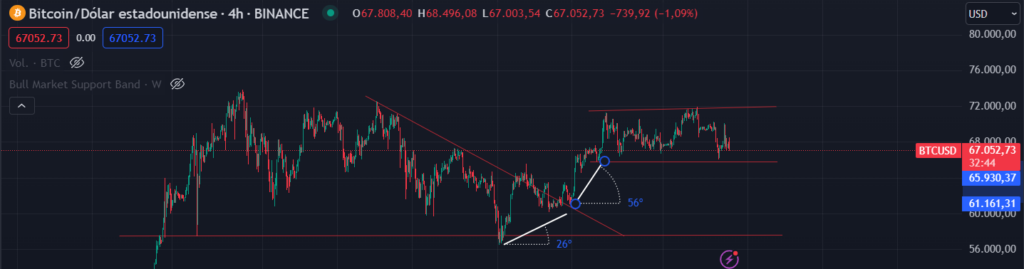
Lines are the most basic example of how these tools are used: they are used to draw trends, guidelines, channels, control points, etc. Another useful line is the trend angle, which allows the steepness of a trend to be measured, giving information about the strength and continuity of price action. Angles greater than 50 degrees can be considered strong, both up and down.
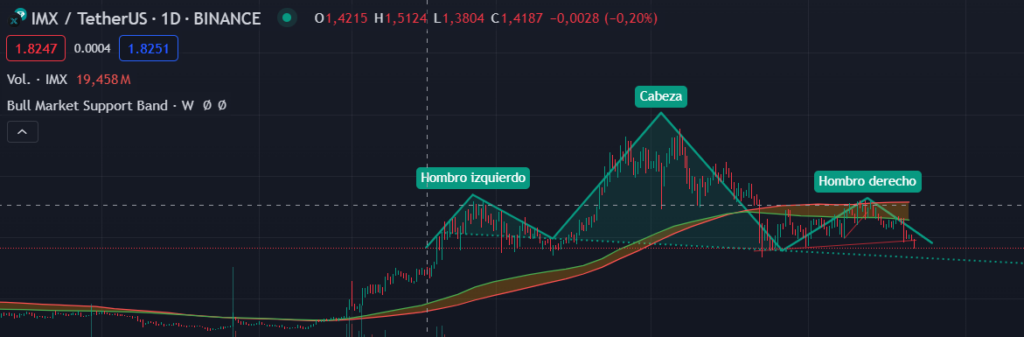
Another very useful tool on this panel, but which requires advanced prior knowledge of graphic figures (Elliot waves, bullish and bearish flags, head-shoulders) and their consequences on price action, are the so-called patterns. They are activated by clicks as they are already predefined; they are used to draw, with a little help, some classic patterns. chartists.
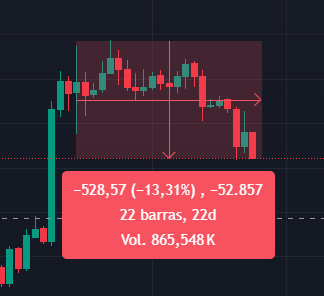
One last useful tool on this panel is the measuring rule. It is used to quickly and accessibly measure the price difference, percentage of change, number of bars, time measured in days and volume located from one point on the graph to another point.
The brush, text and emojis are other potentially useful additional features of this panel.
Watchlist and more on TradingView
Remember we learned how to put certain assets on our watchlist? Now you just need to know how to check them. You can do so by visiting the right sidebar, which is full of icons. The first one corresponds to the watchlist, which looks like this:
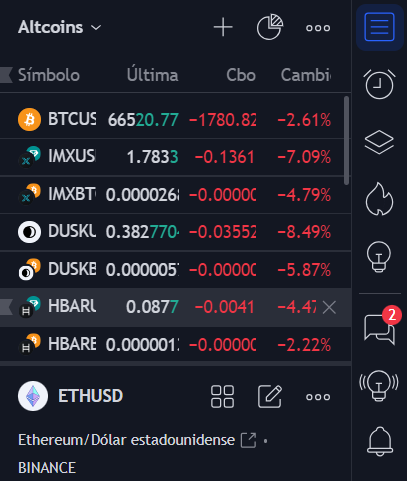
The ultimate utility of the watchlist is that when you click on an asset, a very helpful table opens. containing information about the asset in question. For example, easy-to-read technical indicators, access to news providers on TradingView, performance metrics, among others.
This same menu allows the configuration of alerts and access to trading and investment ideas communicated by other users of the platform. As you can see, TradingView has more things than those mentioned and explained in this tutorial.
However, we now know how to configure and customize a TradingView chart, and we know what tools we can use to edit and analyze it. With all this, and the following recommendations, we will be ready to make basic use of the platform.
Recommendations for using TradingView
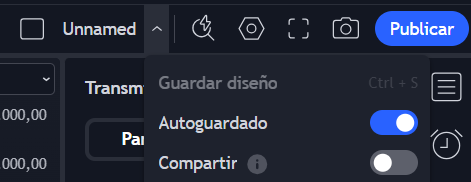
- Save your designs often. Despite autosave, they sometimes get deleted, and you can lose your trend lines, indicators, and more; this can be serious. If you have an open trade and you don’t remember your exit strategyYou can save the design in the top right tab.
- Use only the indicators you need. TradingView can be indecipherable when the screen is cluttered.
- Don’t create your own shapes unless you know how to do it. You may unwittingly be creating mathematical aberrations and basing strategies on meaningless data.
- Use the mouse wheel to zoom in and out on the screen. “control + mouse wheel” to enlarge or shrink the graph. This will save you time.
- Dragging the price scale up or down allows you to expand or collapse the chart.
TradingView has both professional and non-professional plans, and they all vary in the number of charts, alerts, and indicators you can include in a single tab, as well as certain advanced features, such as automatic chart pattern detection.
You can check out the plan offer at the following referral link. When you sign up with this link and purchase a subscription, you will receive a $15 gift.


