Bitcoin investor apathy on the rise: Glassnode
With bitcoin (BTC) trading lower, apathy and a certain degree of fear are growing among many investors. This happens when market volatility “stagnates and goes dormant,” notes cryptocurrency market analysis firm Glassnode.
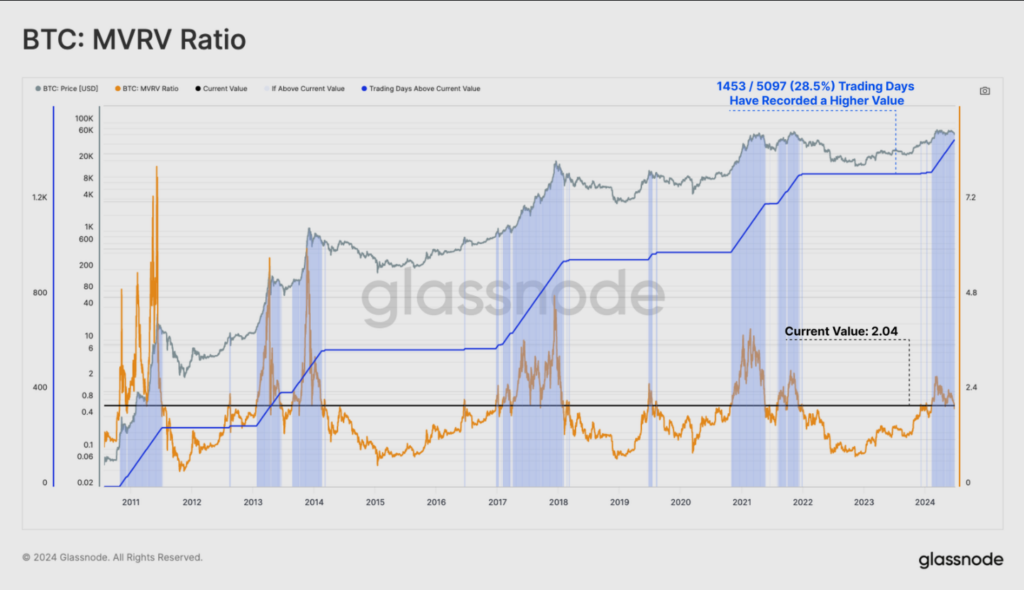
However, according to the MVRV index, an analysis tool used to assess whether an asset is overvalued or undervalued, investors in the digital currency are still making considerable profits.
Overall profitability remains high; on average, investors have doubled their money. Historically, when the MVRV reaches this level (2x earnings multiple), it has preceded bull market periods marked by great optimism and euphoria, the on-chain analytics firm explains.
A high MVRV ratio indicates that bitcoin is overvalued, while a low MVRV ratio indicates that it is undervalued. The current MVRV ratio is 2.04, which is within the historical average range.as reflected in the following image.
The report also outlines two groups: currencies that are in a position of unrealized gains or losses. This allows the situation of each group to be analyzed in terms of their average cost basis and the magnitude of unrealized gains or losses.
The unrealized gains group has average benefits of $41,300 on a cost basis of $19,400. This means that, on average, investors in this group have doubled their money..
In the unrealized loss group, the average return is -$5,300 with a cost basis of $66,100. This means that, on average, Investors in this group have lost around 8% of their investment.
These coins are mostly held by short-term holders, as most of the “notable buyers” of the 2021 bull cycle have already sold them. However, newer buyers are disproportionately “deep in their positions.”
Indecision in the Bitcoin market
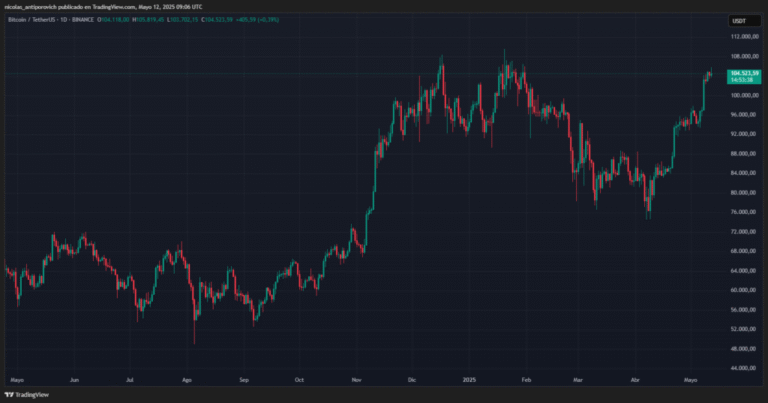
Glassnode notes that bitcoin prices “have consolidated within a well-defined range of $60,000 to $70,000 since the all-time high in March.”
The digital currency hit an all-time high (ATH) of $73,800, fueled by a boost from US-issued Bitcoin spot ETFs, last January.
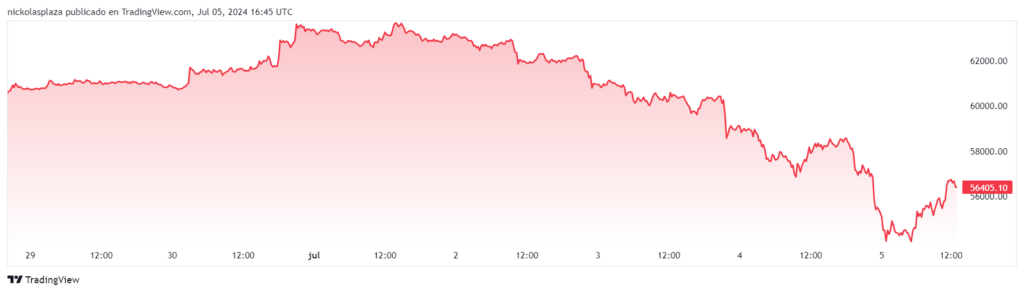
Although bitcoin has maintained a price sideways movement since June 23, when it fell from $70,000 and reached $59,600, has fallen below $60,000 in the past two daysIt is currently trading at $56,300, as reflected in the following TradingView chart.
This means that The current price remains within the enthusiastic bullish regimeaccording to Glassnode. It is a price between the all-time high and the real market average, with brief forays into the euphoric zone. Prices at which BTC is traded above the ATH of previous cycles, as shown in the chart.
“This remains a key price level that the market must hold above if the macro bull market is to continue,” Glassnode warns.
For the Spanish influencer and trader SantinoCriptothe trend will be bearish in the next 2 or 3 months. Consider that the price should be kept under surveillance in case it reaches the support level of $50,000.
If it falls below that price, a bear market lasting at least 5-6 months will be confirmed, he estimates. This could be happening because many Bitcoin miners “will not be able to sustain their businesses and possibly what big whales and big mining companies are looking for is to eat the fish,” the trader points out.
An example of this was last week when a “whale” (an entity that owns more than 1,000 BTC) bought more than 7,700 BTC. The investor or entity that owns this wallet is at the level of the large bitcoin ETFs, such as Fidelity, which stores 167,900 BTC, as reported by CriptoNoticias.
Bitcoin volatility decreased
“After several months of range-bound price action, we are seeing a marked decrease in volatility across many rolling window timeframes,” the report explains.
The following chart evaluates the 30-day change in realized volatility in 1-week, 2-week, 1-month, 3-month, 6-month, and 1-year time frames.
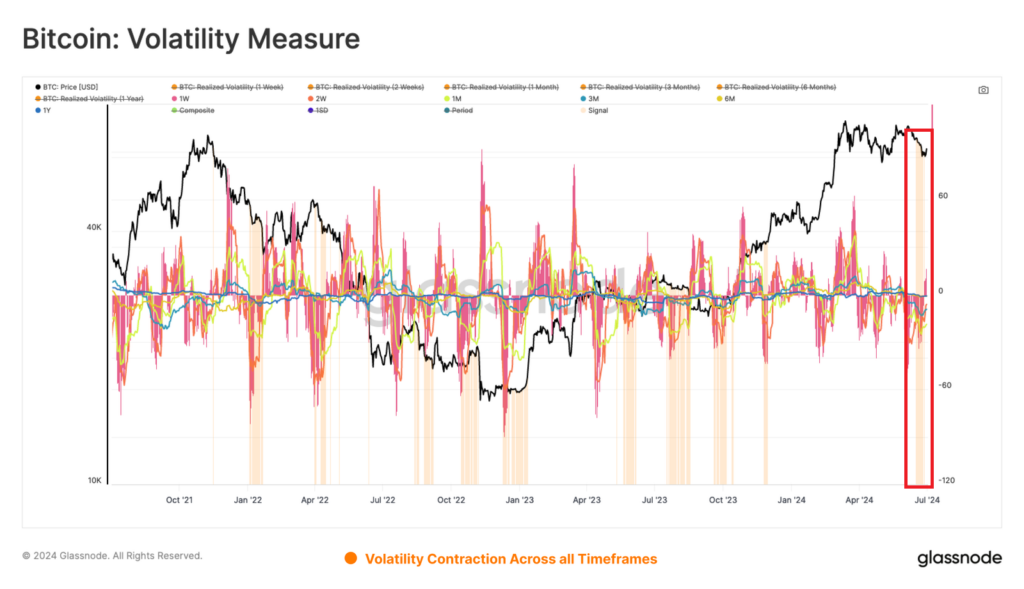
When all windows show a negative 30-day change, A signal is triggered that infers that volatility is being compressedIn the image above you can see the current signal inside the red box.
“Volatility continues to compress to levels that are rarely seen, but typically occur after prolonged consolidations and before large market moves,” the report said.
Compressed volatility, that is, low compared to its historical levels, reflects apathy or lack of interest on the part of investors.
Despite the current low volatility, Glassnode suggests that there could be higher volatility in the future. This is based on the idea that volatility can be like a kind of compressed spring, which is ready to break out with force at some point.