Check street by street how much your neighbors earn

In Spain, the border between prosperity and precariousness can be found just a few streets away. Although household income continued to grow in 2023 in almost the entire country, this increase did not always translate into a real improvement in purchasing power.
Between 2019 and 2023, income rose in practically all census sections, but in one in three the increase was not enough to compensate for the accumulated inflation of 15.5% in that period. The photograph left by the Atlas of Household Income Distribution of the National Institute of Statistics (INE) thus shows a country where economic progress is perceived unequally depending on the neighborhood in which you look.
The data comes from the median per unit of consumption, an indicator that weights the income of each household according to its size and composition. This method takes into account that a couple that earns 3,000 euros per month is not the same as a family with children or dependents who shares that same income.
Unlike the mean, the median better reflects the typical situation of households, since avoids distortions caused by very high incomes. On the map, the values range between 7,350 euros for the lowest percentile and 44,450 for the highest percentile, offering a detailed x-ray of the inequalities within the territory. Of course, the data must be interpreted with caution: some methodological changes, residential movements or specific income can generate variations that do not always reflect real transformations in income.
Find out if you live in a rich or poor neighborhood
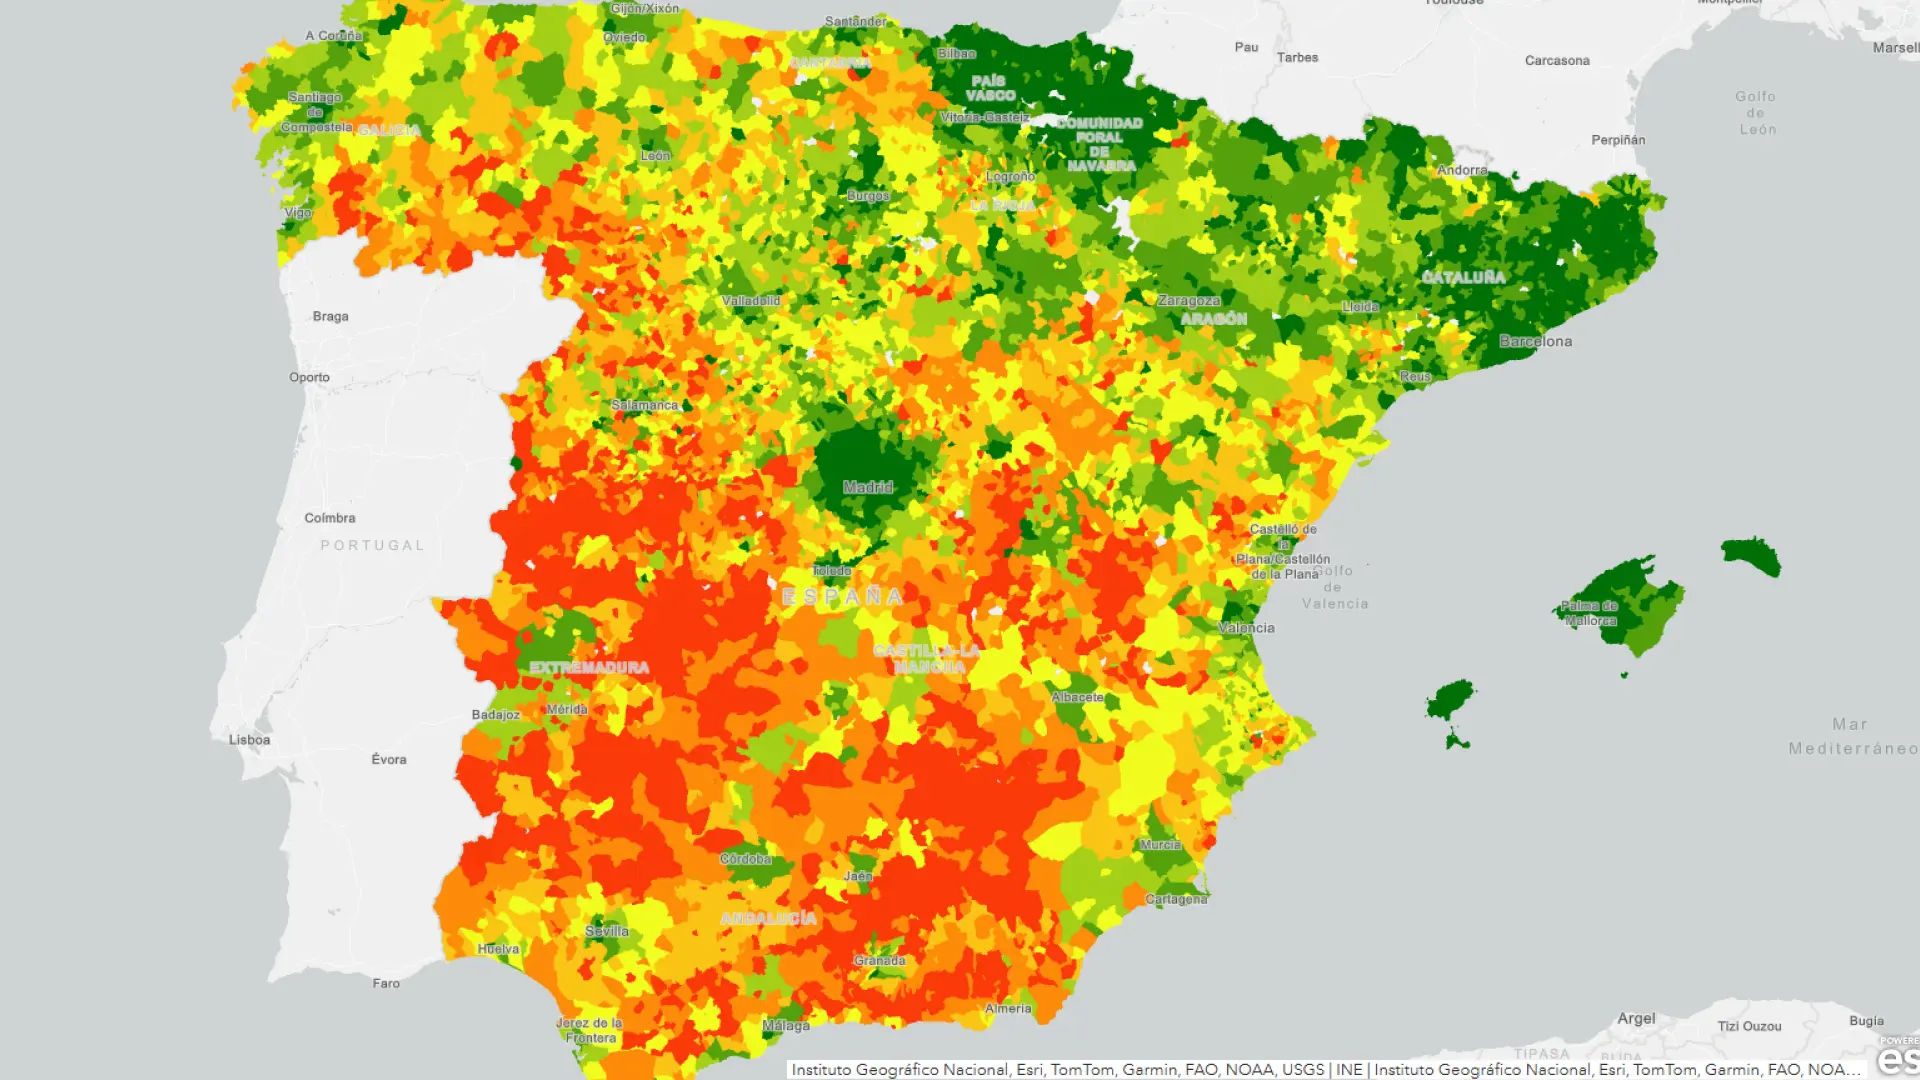
The INE interactive map allows you to explore these economic differences at a glance. Each neighborhood is colored according to its income level: the areas in red correspond to households with income between 17,449.9 and 25,415.8 euros, while orange and yellow tones mark average incomes, between 25,000 and 32,000 euros.
As the color turns green, income increases: neighborhoods in soft green exceed 32,486 euros, those in intense green reach 40,000 and those in dark green, the most affluent areas, can reach 96,000 euros annually.
The tool, available at the census section level, reveals how within the same city—and even within the same district—very different economic realities coexist, sometimes separated only by a street or a square.